For this research pick I’ll be addressing a recent paper by Pasiakos and colleagues [1]. In this study they evaluated the effect of 200 mg testosterone enanthate weekly for a period of 4 weeks during a diet- and exercise-induced energy deficit of 55%. The study was a randomised double-blind controlled trial and showed that the testosterone group increased in lean body mass while the placebo group maintained it. However, lower-body muscle function did not differ between both groups. They decreased similarly in both.
I’ll go over the details of this paper with some comments below.
Study set-up
The participants in this study were healthy, physically active men aged 18 to 39 years old. On average they were 25 years of age and they defined physically active as performing at least 2 aerobic or resistance exercise sessions per week. The anthropometric data tells us that they were about 1m78 tall and weight on average around 77 to 81 kg. Their fat percentage was around 21 to 23%, so they weren’t particularly lean athletes. They had some fat to shed.
Anyways, the participants were randomized to a control group or a testosterone group. The control group received a weekly injection of 1 mL sesame oil. The testosterone group also received a weekly injection of 1 mL oil, but the oil contained 200 mg testosterone enanthate. A total of 50 subjects was randomized and they all completed the study.
The trial was set up with 3 phases. The first phase was 2 weeks in free-living conditions, but with controlled feeding (eucaloric diet with 1.6 g/kg bw protein). Nothing much really.
The second phase was the actual intervention phase. Participants randomized to the testosterone group now received their weekly testosterone injections and the placebo group their weekly sesame oil injections. This phase lasted 4 weeks, so the participants would receive 4 injections in total (day 14, 21, 28 and 35). Now, besides those fancy injections, participants were put on a 55 % energy deficit. This energy deficit was obtained by adding a lot of exercise and reducing caloric intake: a diet- and exercise-induced deficit. To highlight: the exercise was aerobic exercise, not resistance exercise. (The goal was to reflect the physical work sustained during military operations.)
The final phase was the recovery phase and lasted 2 weeks. This phase was also under free-living conditions and the participants could eat whatever they’d want again.
During these phases the researchers measured a lot of stuff. About a billion health-related markers, body composition using DEXA, lower-body strength and endurance and muscle fiber cross-sectional area (CSA) and fiber type CSA distribution. I’ll be ignoring the health-related stuff for this research pick. (In brief: nothing noteworthy in regard to the health-related stuff).
Results: testosterone group increased LBM, placebo group maintained LBM and both lost lower-body strength and fat
I’ve put the body composition results in the table below. Remember: phase 1 is the 2-week ‘lead-in’ phase, just a controlled diet to maintain body weight. Phase 2 is the 4-week diet- and exercise-induced energy deficit phase, and phase 3 is the 2-week recovery phase with ad libitum eating.
| Testosterone | Placebo | |||||
|---|---|---|---|---|---|---|
| Phase 1 | Phase 2 | Phase 3 | Phase 1 | Phase 2 | Phase 3 | |
| Total mass (kg) | 78.0 | 75.8 | 79.3 | 78.3 | 73.3 | 76.5 |
| Lean mass (kg) | 57.9 | 60.4 | 63.1 | 58.3 | 58.0 | 60.5 |
| Fat mass (kg) | 16.8 | 12.0 | 12.8 | 16.8 | 12.2 | 12.8 |
Both groups lost fat mass to a similar degree.
LBM remained practically the same in the placebo group during phase 2 despite the large energy deficit. This comes a bit of a surprise, but there are a few reasons why this could occur. For one, aerobic exercise can also provide an anabolic stimulus, albeit a lot weaker than that of resistance exercise. So the increase in exercise during this phase could have provided somewhat of an anabolic stimulus. Additionally, they had 23 % body fat on average. That’s not a lot a lot, but it’s far from being lean. LBM loss is lessened with higher body fat percentages. Additionally, 4 weeks is not that long.
Now, in the testosterone group LBM increased by 2.5 kg during phase 2. Ha, awesome. But does that mean they gained muscle mass? I’ll get to that. Let’s first also look at the lower-body strength and endurance measurements. I’ve put them in the table below.
| Testosterone | Placebo | |||||
|---|---|---|---|---|---|---|
| Phase 1 | Phase 2 | Phase 3 | Phase 1 | Phase 2 | Phase 3 | |
| Isometric peak torque (Nm) | 245 | 219 | 214 | 243 | 219 | 229 |
| Isometric peak torque (Nm/kg LBM) | 24 | 21 | 20 | 26 | 24 | 24 |
| Isokinetic peak torque (Nm) | 200 | 164 | 174 | 195 | 163 | 168 |
| Isokinetic peak torque (Nm/kg LBM) | 20 | 16 | 16 | 21 | 17 | 17 |
| Isokinetic total work (J) | 3339 | 2800 | 3180 | 3423 | 2843 | 2985 |
| Isokinetic total work (J/kg LBM) | 327 | 266 | 291 | 362 | 306 | 307 |
As can be seen, strength dropped similarly in both groups. Wouldn’t that be a bit odd if the testosterone group gained muscle? It’s possible, but it’s a bit unexpected. However, if you also look at the data of the muscle biopsies, it becomes more likely that they didn’t gain muscle mass at all. Below you can see the CSA of the type 1 and 2 fibers, as well as the CSA distribution % of each fiber type.
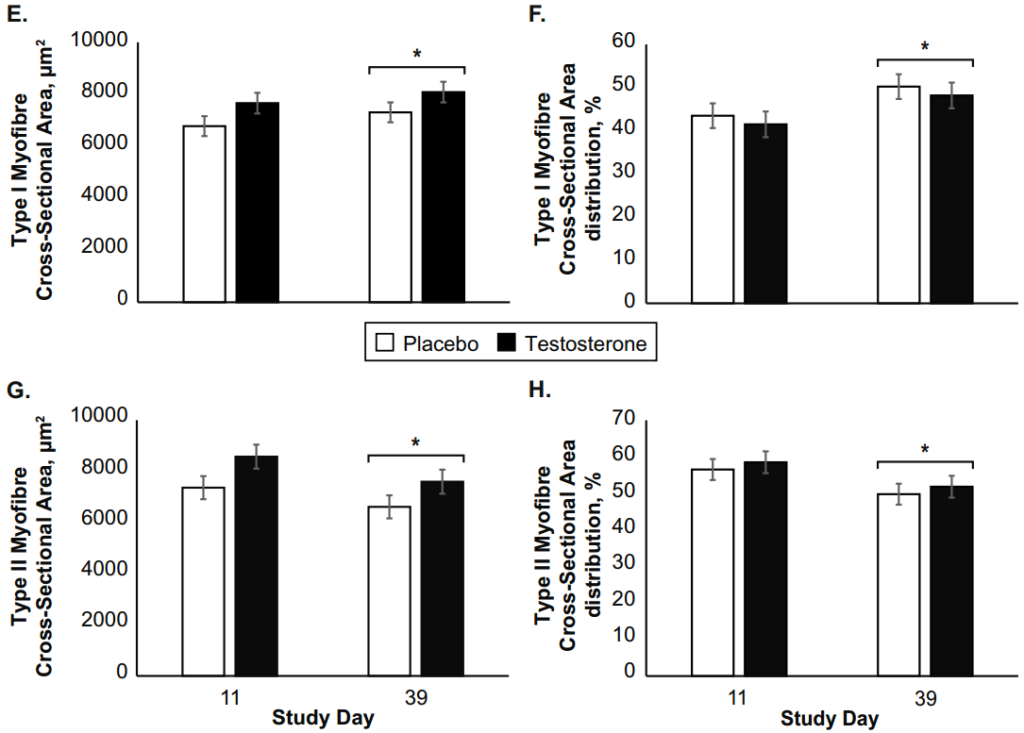
In both groups you see that the CSA of the type 1 fibers increased during phase 2. Which is likely because of all the aerobic exercise these fellas did. This increase was not different between the groups. The same is happening with the type 2 fiber CSA, but in the opposite direction. They shrank in both groups during phase 2, but again, no difference between the groups. Consequently, you see a small increase in the type 1 fiber CSA distribution % in both groups, and a decrease in the type 2 fiber CSA distribution % during phase 2. Again: no difference between the groups.
The matching drop in lower-body strength and changes in muscle fiber CSA suggest that the 2.5 kg increase in LBM was not due to an increase in muscle mass.
So what was it? It could be water retention, but who knows. They didn’t measure that, so it’s a guess. It could be some other tissue than muscle mass, but who knows. Theoretically speaking, it could be upper body muscle mass. There’s no data on upper body strength and the muscle biopsies were taken from a leg muscle (vastus lateralis). Although I really don’t see why upper body mass would increase in this case at all (they did do some light calisthenics). But theoretically that’s possible.
But isn’t testosterone super awesome? It is. But 200 mg testosterone enanthate weekly, while a supraphysiological dosage, is really on the low-low end of supraphysiological dosages used by athletes. Moreover, 4 weeks is a short period of time (and note that the muscle biopsies were taken after 3.5 weeks), so these 2 factors could make it hard to be effective under these circumstances with a large energy deficit.
Concluding, the 2.5 kg increase in LBM found in the testosterone group does not appear to be muscle mass.
- Pasiakos, Stefan M., et al. “Effects of testosterone supplementation on body composition and lower-body muscle function during severe exercise-and diet-induced energy deficit: A proof-of-concept, single centre, randomised, double-blind, controlled trial.” EBioMedicine (2019).